

Implement Plotly Library in React with TypeScript
Integrating Plotly with React and TypeScript allows developers to create dynamic, interactive charts with ease. This guide will walk you through the steps to implement Plotly in a React TypeScript project with a simple example. Let’s get started.
First and foremost, create a new React project with TypeScript. Open your terminal and run:
npx create-react-app plotly-react-ts --template typescript
cd plotly-react-ts
Next, install the Plotly library and its React wrapper. This ensures you have all the necessary packages to work with Plotly in your React components. Run the following commands:
npm install plotly.js react-plotly.js
npm install @types/react-plotly.js --save-dev
With the packages installed, you can now create a component to render a Plotly chart. Start by creating a new file called PlotComponent.tsx in the src folder. This component will use react-plotly.js to render the chart.
PlotComponent.tsx:
import React from 'react';
import Plot from 'react-plotly.js';

const PlotComponent: React.FC = () => {
  return (
    <Plot
      data={[
        {
          x: [1, 2, 3, 4],
          y: [10, 15, 13, 17],
          type: 'scatter',
          mode: 'lines+markers',
          marker: { color: 'red' },
        },
        {
          x: [1, 2, 3, 4],
          y: [16, 5, 11, 9],
          type: 'scatter',
          mode: 'lines+markers',
          marker: { color: 'blue' },
        },
      ]}
      layout={{ title: 'Simple Plot' }}
    />
  );
};

export default PlotComponent;
Then, integrate this component into your main application. Open src/App.tsx and update it as follows:
App.tsx:
import React from 'react';
import PlotComponent from './PlotComponent';
const App: React.FC = () => {
return (
<div className="App">
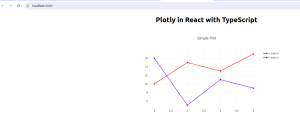
<h1>Plotly in React with TypeScript</h1>
<PlotComponent />
</div>
);
};
export default App;
Finally, start your application by running:
npm start
This command will launch the development server, and you can view your Plotly chart by navigating to http://localhost:3000 in your browser.
Conclusion:
implementing Plotly in a React TypeScript project involves setting up your project, installing necessary packages, and creating components to render the charts. Use this approach whenever you need to create visually appealing, interactive charts in your React applications. The flexibility of Plotly combined with the type safety of TypeScript ensures you build robust and scalable charting solutions.