

Implementing Plotly Library in Angular
Integrating Plotly with Angular enables developers to create interactive, high-quality charts and graphs. This guide will walk you through the steps to implement Plotly in an Angular application with a simple example. Let’s dive right in.
First and foremost, you need to set up your Angular project. If you haven’t already, create a new Angular project using the Angular CLI. Open your terminal and run:
ng new plotly-angular
cd plotly-angular
Next, you need to install the Plotly library along with its Angular wrapper. This ensures that you can seamlessly integrate Plotly’s functionality into your Angular components. Run the following commands:
npm install plotly.js angular-plotly.js plotly.js-dist-min
npm install @types/plotly.js-dist-min --save-dev
Then, you must add PlotlyModule to your Angular application. Open src/app/app.module.ts and import the necessary modules:
import { BrowserModule } from '@angular/platform-browser';
import { NgModule } from '@angular/core';
import { AppComponent } from './app.component';
import { PlotlyModule } from 'angular-plotly.js';
import * as PlotlyJS from 'plotly.js-dist-min';

PlotlyModule.plotlyjs = PlotlyJS;

@NgModule({
  declarations: [
    AppComponent
  ],
  imports: [
    BrowserModule,
    PlotlyModule
  ],
  providers: [],
  bootstrap: [AppComponent]
})
export class AppModule { }
Now, you can create a component to display a Plotly chart. For simplicity, let’s modify the AppComponent. Open src/app/app.component.ts and add the following code:
import { Component } from '@angular/core';
@Component({
selector: 'app-root',
templateUrl: './app.component.html',
styleUrls: ['./app.component.css']
})
export class AppComponent {
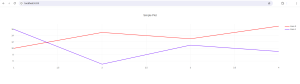
public graph = {
data: [
{ x: [1, 2, 3, 4], y: [10, 15, 13, 17], type: 'scatter', mode: 'lines+points', marker: {color: 'red'} },
{ x: [1, 2, 3, 4], y: [16, 5, 11, 9], type: 'scatter', mode: 'lines+points', marker: {color: 'blue'} },
],
layout: { title: 'Simple Plot' }
};
}
Next, update src/app/app.component.html to include the plot component:
<div>
  <plotly-plot [data]="graph.data" [layout]="graph.layout"></plotly-plot>
</div>
With these steps completed, you can now run your Angular application. Execute:
ng serve
Finally, navigate to http://localhost:4200 in your browser. You should see a simple Plotly chart with red and blue data points and lines.
Conclusion:
Implementing Plotly in Angular involves setting up your project, installing necessary packages, configuring the module, and creating a component to display your charts. Use this approach whenever you need interactive and visually appealing charts in your Angular applications.